
Which are the most culturally diverse areas in Australia?
24 Jan 2023
As a foodie residing in Sydney, I am always thankful for the cultural diversity of Australia that provides us with the variety of cuisine and the authenticity of food. Without a plane ticket, I can catch up with friends over a hotpot in Haymarket, indulge myself with Korean BBQ in Strathfield, enjoy tacos and margarita after a nice swim in Bondi, and more. Not limited to only our food choices, Australia’s cultural diversity manifests itself across all aspects of our lives and in the demographic of our communities.
Australia is a vibrant, multicultural country with 28% of the residents born overseas and 23% speaking a non-English language at home based on Census 2021. But are we evenly multicultural across Australia or are some cities and suburbs more so than others?
In this post, we explore what could be considered as the most culturally diverse areas in Australia using the latest 2021 Census data. One way to look at this is to create a quantifiable measure of cultural diversity based on a combination of ancestry, birthplace and languages used at home. We borrowed the concept of Herfindahl–Hirschman index (HHI) and consolidated these metrics to create such measures.
Herfindahl–Hirschman index (HHI)
Herfindahl–Hirschman Index (HHI) is commonly used to quantify market concentration. It is calculated by squaring the market share of each segment competing in the market and then summing the resulting numbers. Lower values indicate a less concentrated market.

HHI is reflective of the concentration of cultural groups in an area. From a mathematical perspective, HHI is a great indicator of cultural diversity because the metric takes into account both the number of cultural groups as well as how evenly distributed they are. Instead of simply looking at the distinct number of cultural groups, it more accurately measures the cultural diversity of an area.
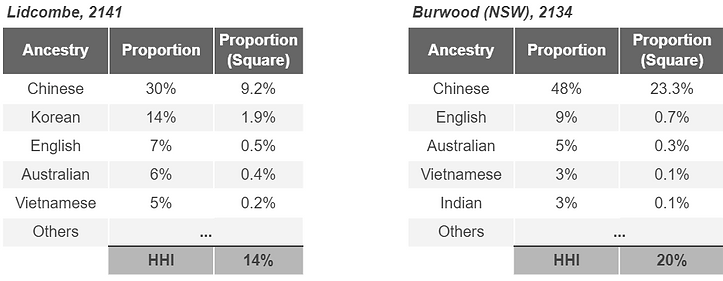
Here is a simplified example to help better understand HHI.
Let’s compare Lidcombe and Burwood. Both areas have a variety of cultural groups. However, Burwood is calculated to be less culturally diverse based on HHI mostly due to the higher proportion of Chinese Ancestry in the area. Please note that the example here only shows the breakdown by ancestry for illustrative purposes. Our results in this blog are based on a combination of ancestry, country of birth and languages spoken at home.
NSW and VIC are the most culturally diverse states
The most culturally diverse states in Australia are NSW and VIC. These 2 states scored similar results with our HHI and the similarities don’t stop there. The top 5 ancestries of both states are English, Australian, Chinese, Irish and Scottish. We also found that China, India, England and Vietnam are the most common countries where immigrants are from.
The next most culturally diverse state is NT, this is driven by the large population of Aboriginal and Torres Strait Islander in the NT. We found that 9% of the population in Greater Darwin are Aboriginal and Torres Strait Islander (compared to 3% nationally).
The least culturally diverse state according to our HHI is Tasmania where English and Australian are the most common ancestries, reflecting the history of English-born settlers in Australia. We found that 43% and 38% of the Tasmanian residents in the greater capital area are from English and Australian backgrounds respectively.
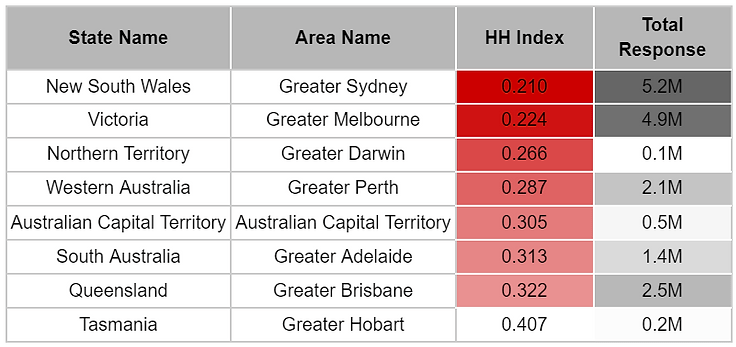
Please note the analysis done for this article exclusively included the Greater Capital Statistical Areas(GCCSAs). According to ABS, GCCSA boundaries represent labour markets and the functional area of Australian capital cities respectively.
In the next part of the article, let’s deep dive into the suburbs of the top 2 culturally diverse states NSW and VIC.
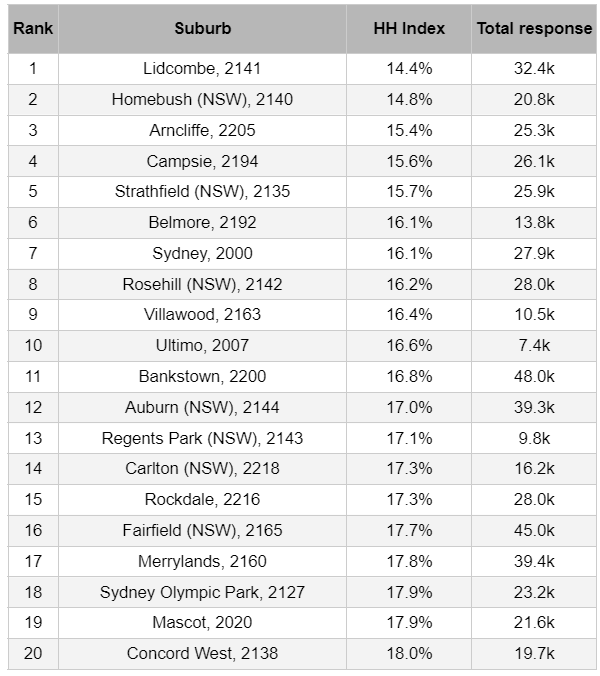
Lidcombe is the most culturally diverse suburb in NSW
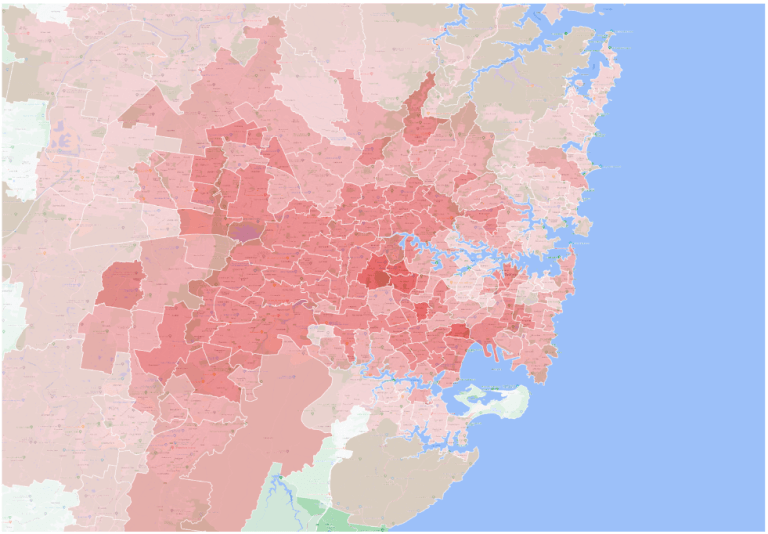
The western suburbs, especially the Canterbury-Bankstown area and the CBD area are the cultural diversity hubs of Sydney. Among the greater Sydney area, Lidcombe scores the lowest HHI which means it proudly can call itself the most culturally diverse area. Chinese (28%) and Korean (18%) surpassed English (6%) and Australian (6%) to become the top 2 ancestries of this suburb. Over two-thirds of Lidcombe residents are immigrants who were born outside of Australia. The CBD area and Ultimo are also in the top 10 likely due to being convenient locations for expats and international students.
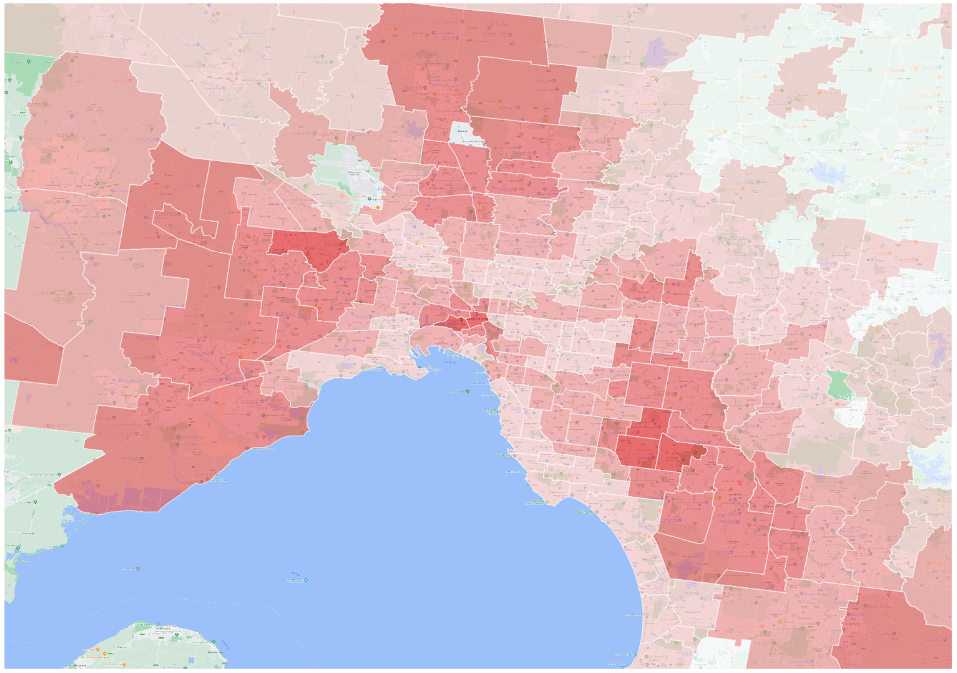
As you can see from the heatmap, the further away you are from the city centre, the less cultural diversity you may experience. Further away areas from the CBD like the Blue Mountain region and coastal areas like Northern beaches are relatively less culturally diverse based on this measurement approach. These areas tend to have a very dominant cultural group, which in this case would be Australian or English. For example, Palm Beach has a 59% HHI with more than half of the residents being English descendants and more than 70% being Australian-born.
Top 20 culturally diverse areas in Greater Sydney Area
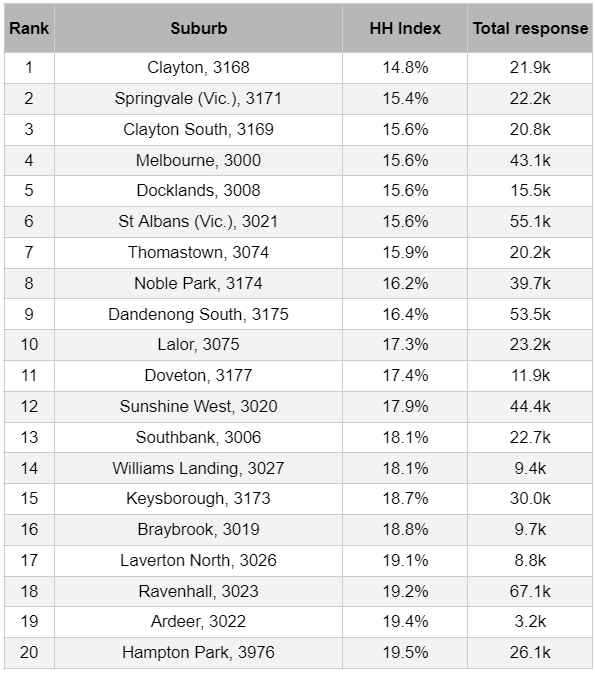
Clayton is the most culturally diverse suburb in VIC
Clayton tops the list of Victoria, in part attributable to its large population of Chinese (25%) and Indian (14%) descendents and immigrants. More than 3 out of 5 residents speak a non-English language at home. The cultural diversity in Clayton is also likely driven by the fact that it’s home to science and technology institutions including Monash University, Monash Medical Centre, etc. which attracts a great number of global talents, professionals and international students.
HHI picked up a few notable areas which have a higher proportion of Vietnamese Australians, including Springvale, St Albans, Sunshine West, and Braybrook as part of the top 20. Vietnamese ancestry ranked the highest, edging out Australian and Chinese to be the most populous ancestry in these areas and Vietnamese being the most popular language to speak at home other than English.
Melbourne is also known for its authentic Greek and Italian restaurants. Among the top 20 list, we can see a few suburbs where Greek and Italian communities reside, such as Thomastown and Lalor. Italian, Macedonian and Greek are the top 3 ancestries for these 2 suburbs besides Australian and English.
Top 20 culturally diverse areas in Greater Melbourne Area
While exploring the same topic using the latest Census data, an article from ABC News considered Point Cook in VIC to be the country’s most multicultural suburb based on the fact that the residents are from 86 different countries. However, Point Cook (3030) ranks slightly lower using this measure because despite this suburb having the most distinct birthplaces, we observe a less even distribution of birthplace and languages spoken at home. This topic is also featured on SBS News where they provided a series of interactive maps to show how multicultural suburbs are. Our results provide a slightly different angle using HHI to take into account the distribution of ancestry, birthplace and languages spoken to measure culture diversity.
As Australia becomes increasingly diverse, it is reflected in our vibrant arts and culture scene. With many multicultural festivals and events happening throughout the year, such as the Lunar New Year, it is a perfect chance to celebrate and be proud of this wonderful country and its unique culture.
About the Author
Charlotte Pan is data analytics consultant at EdgeRed Analytics with a Masters in Statistics and IT from the University of New South Wales. She lives in Sydney and enjoys trying new restaurants and cuisines.
About EdgeRed
EdgeRed is an Australian boutique consultancy specialising in data and analytics. We draw value and insights through data science and artificial intelligence to help companies make faster and smarter decisions.
Subscribe to our newsletter to receive our latest data analysis and reports directly to your inbox.