The Great Wall of houses: Navigating Australia's living and housing costs
6 May 2024
Owning a home is often seen as the cornerstone of the Australian dream, but soaring house prices are casting long shadows over that dream. Today, we’ll dive into the Australian housing crisis, taking a comparative look at the situations in the US, UK and Canada, and we’ll even touch on the Big Mac index for good measure.
Australia: A Land of Plenty and Homes are scarce
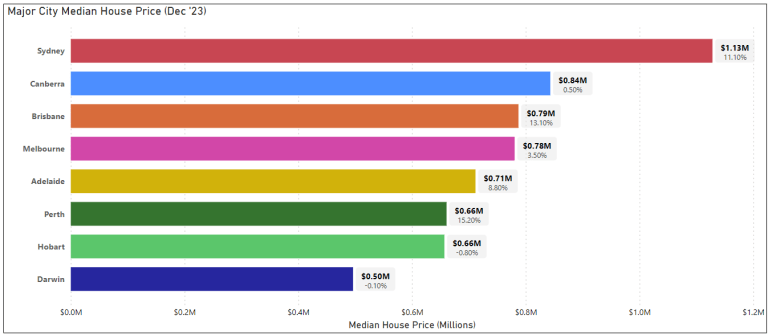
According to CoreLogic, Australia boasts a median house price of a hefty $757,746 (AUD), a price tag that’s grown by 70% over the last 10 years and 53.6% in the last 5 years! This rapid inflation in recent years has pushed the house price-to-income ratio (HPI) to a concerning 8.34, meaning the average Aussie needs to dedicate almost 8 years’ worth of income to buy the average house. And if you’re looking to crack into the Sydney market, be prepared to cough up an eye watering $1.1 million (AUD) pushing the HPI to 12.19.
Below is a breakdown of each of the major Australian cities and their median prices in each city and in the table we can see the growth experienced just this year alone up till December 2023.
Across the Seas: Similarities and Differences
While Australia’s housing woes are prominent, they’re not unique. Our international counterparts face similar challenges:
The US: While experiencing a slight dip in prices, the US median house price sits at a still sizable $431,000 USD ($639,655 AUD) which has grown 70.2% in the last 10 years.
The UK: Houses across the pond haven’t seen the same astronomical rises as Australia, but their median price of $277,500 GBP ($521,812 AUD) still represents a 39.4% increase over a decade.
Canada: Our northern neighbours boast a median price of $735,500 CAD ($818,313 AUD), inflated by 65.5% in 10 years, leading to an HPI of 7.8.
A notable mention also includes Hong Kong SAR as an extreme case of housing price affordability. According to the Urbane Land Institute (ULI) the median price is currently $7.4 million HKD ($1.4 million AUD) for apartments which provides a HPI of 18.8. This doesn’t include the standalone houses that have a median price of $34 million HKD ($6.5 million AUD). As much as some countries are in a similar boat as us there are edge cases that are experiencing astronomical house price changes.
The Cost of Living Conundrum: Inflation and Beyond
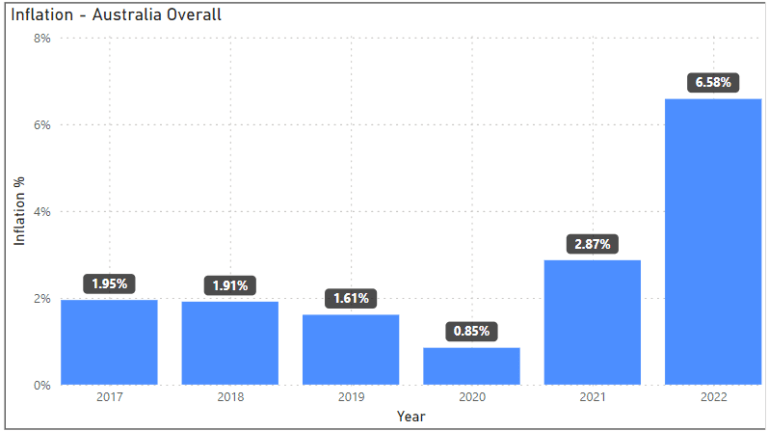
Inflation is an economics term that is commonly thrown into conversations when talking about housing prices and cost of living. Inflation is measured using the Consumer Price Index (CPI) and the cost of living changes and is crucial in the housing equation and will be used as a metric here. After doing some analysis on Federal Reserve Economic Data (FRED) data we can see that Australia’s recent inflation hike that as of 2022 was at an unprecedented high (shown graph below), undoubtedly contributed to rising house prices. The US and Canada saw similar patterns, while the UK experienced a milder effect.
In the graph below, the bars represent the inflation % (represented by the average change in CPI).
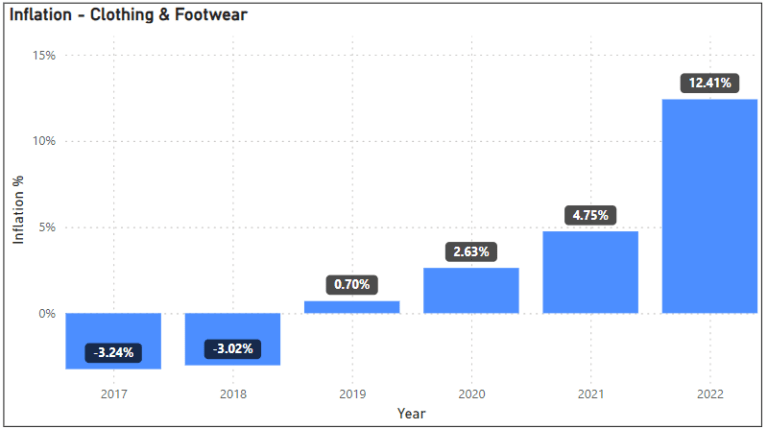
Consumers in 2017 and 2018 would have been experiencing very affordable clothing and footwear at the time with inflation being in the negative, showing that prices were dropping. Moving into 2019 we see an already significant increase, where consumers would have experienced very small increases with inflation at 0.7%. From 2019 onwards we see large leaps of 376% from 2019 to 2020 alone but between 2019 and 2022 we have seen a total increase of 1773% on the original inflation figures.
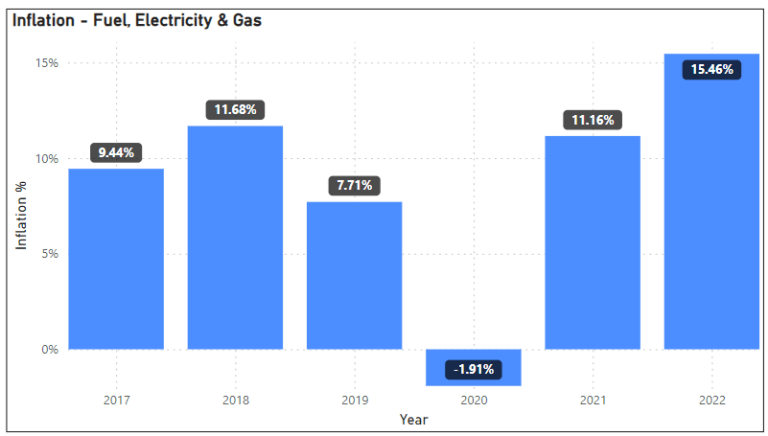
The fuel, electricity and gas category encapsulates critical consumable goods. Australia has seen heightened inflation in this category in comparison to others. Inflation here saw an increase (24%) between 2017 to 2018 which has been displayed in clothing and footwear as well but we notice an earlier decline in inflation between 2019 and 2020 and a similar drop in 2020 before massive increases in 2021 through to the end of 2022. Looking at the total period, due to the heightened price of Fuel, Electricity & Gas the total increase in inflation over 5 years is 164% which seems reasonable in comparison to Clothing & Footwear. This increase is also reflected in the consumer shift towards more budget-friendly and electric vehicles, which was discussed in our vehicle trend blog.
Inflation for consumerist transport (excluding commercial) jumped from what seemed to be a reasonable 2.62%, rose significantly to 5.31% from 2017 to 2018 before sitting steady for the next year. After what looked to be a heightened period of inflation, that growth period significantly dropped from 2020-2021 before a shocking increase in 2022 to 15.11%. Transport would be thought to have a reliance on the Fuel, Electricity & Gas category but there doesn’t seem to be strong similarities in the pattern besides a strong increase in 2022. For Transportation, this increase was much more dramatic than Fuel, Electricity & Gas (a change in inflation rate of 4.3%), where inflation was seen to go up from -1.04% to 15.11% (a change in inflation rate of 16.15%).
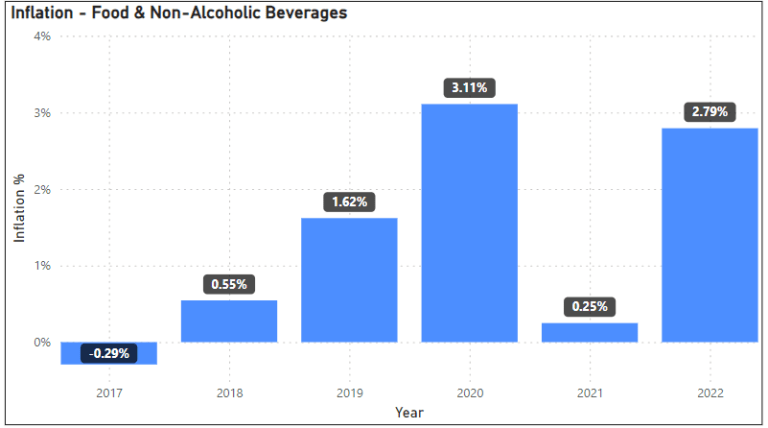
A hot topic in the cost of living conversation is the costs of groceries but prior to 2020, there was steady change in inflation for this group, growing from -0.29% to 3.11% in 2020. After 2020, there was a large drop in inflation of about 92%. And then following a similar pattern to the other groups, spiking in 2022. The behaviour of this category tends to show a similar pattern of increase with the Clothing & Footwear trend but acts differently in 2021 with a significant drop instead of another increase.
While overall inflation has increased 4.63% from 1.95% in 2017 to 6.58% in 2022 over five years, the cost-of-living picture is surprisingly diverse. All consumer product groups looked at have had an overall significant increase, although over the period from 2017 – 2022 it is interesting to see their behaviours.
Clothing & Footwear has increased consistently despite drops in other categories.
Fuel, Electricity & Gas tends to have very high inflation growth throughout this period analysed so the differences between years aren’t as great.
Transportation has seen some erratic patterns and one of the biggest increases from 2021 – 2022.
Food and Non-Alcoholic Beverages has seen some change but the overall rate of inflation as a category sees little change in actual change in the inflation rate ranging from 0.29% to 2.79%.
However, the housing market seems blissfully unaware, continuing its ascent.
Australia and the Big Mac Bite
While not a scientific measure, the Big Mac Index offers a quirky glimpse into purchasing power parity (PPP), which suggests that, in theory, goods and services should cost the same in different countries when adjusted for currency exchange rates. The Big Mac, with its standardized ingredients and global presence, acts as a proxy for a comparable basket of goods.
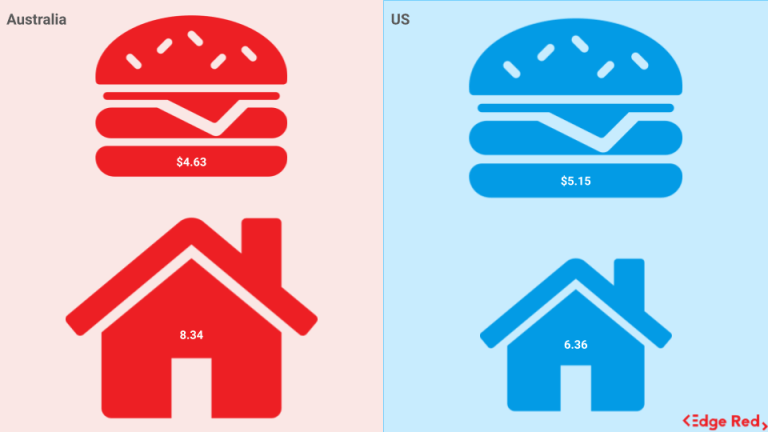
After analysing some data from The Economist on the Big Mac index, Australians are paying $4.63 USD for a Big Mac, while their counterparts in the US shell out $5.15 USD . Although slightly cheaper than Canada’s $5.25 USD, this seemingly affordable burger masks a larger disparity: Australia’s Housing Price Index (HPI) stands at a hefty 8.34 compared to the US’s 6.36. This suggests that despite comparable costs for basic goods like Big Macs, Australians face a considerably steeper climb when it comes to housing.
Conclusion
In conclusion, Australia’s housing affordability crisis stands out amongst its international peers, with soaring median prices and a disconnect between cost-of-living increases and housing valuations. While factors like inflation and global trends play a role, understanding the complexities within our domestic landscape, from diverse cost-of-living changes to localised market influences, is crucial for navigating this multifaceted challenge.
Is the Great Australian Dream homeownership, becoming a relic of the past, or can we find solutions to make it attainable for future generations? Successfully achieving homeownership in Australia demands well-informed choices and a keen understanding of the distinct factors influencing the housing landscape. Together, let’s continue to unravel the complexities and seek innovative solutions to ensure that the dream of owning a home remains within reach for all Australians.
References
Median House prices – Australian major cities (CoreLogic)
Real Residential Property Prices for Australia (FRED)
Real Residential Property Prices for US (FRED)
Real Residential Property Prices for UK (FRED)
Real Residential Property Prices for Canada (FRED)
Real Residential Property Prices for Hong Kong SAR (FRED)
Consumer Price Index (CPI) Australia (FRED)
CPI – Clothing and Footwear Australia (FRED)
CPI – Energy Australia (FRED)
CPI – Transport Australia (FRED)
CPI – Food and Non-Alcoholic Beverages Australia (FRED)
The Big Mac Index (The Economist)
Frequently Asked Questions
What is the current state of Australia's housing market?
Australia's housing market is experiencing rapid inflation, with the median house price reaching a hefty $757,746 AUD. Over the last decade, prices have surged by 70%, creating a challenging environment for prospective buyers.
How does Australia's housing market compare to other countries?
Australia's housing market shares similarities with international counterparts such as the US, UK, and Canada, all of which have seen significant price increases over the years. However, Australia's housing price-to-income ratio (HPI) is notably higher, indicating a greater affordability challenge for residents.
What role does inflation play in the Australian housing market, and how does it impact the cost of living?
Inflation, measured using the Consumer Price Index (CPI), is a significant factor contributing to rising house prices and cost-of-living changes. The analysis of FRED data reveals that Australia's recent inflation hike, particularly in categories like clothing, footwear, fuel, electricity, gas, transportation, and food, has influenced the housing equation by affecting purchasing power and affordability.
What dataset was utilised for the analysis presented in the blog?
The analysis in the blog utilised datasets from various sources, including CoreLogic for median house prices, the Urbane Land Institute for housing price affordability in Hong Kong SAR, and FRED (Federal Reserve Economic Data) for inflation and cost-of-living metrics. These datasets were crucial for examining trends and patterns in housing prices and cost-of-living changes over time.
About EdgeRed
EdgeRed is an Australian boutique consultancy specialising in data and analytics. We draw value and insights through data science and artificial intelligence to help companies make faster and smarter decisions.
Subscribe to our newsletter to receive the our latest data analysis and reports directly to your inbox.